|
Fuquay-Varina Weather |
-

- Weather station
- Weather
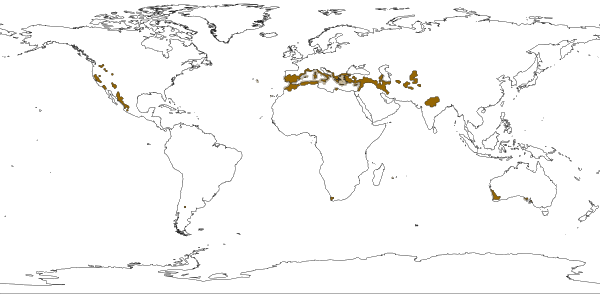
- Climate
- Europe
- CO2 Levels
- Country Climate Data
|
|
Fuquay-Varina Weather |

|
|
|
|||||||||||||||||
|
||||||||||||||||||
 64 °F 56 / 72 |  29.2 in 113 days |  69 % |
|
|
|
| Temperature |
+
|
| Month | Average | ||||||||||||
|---|---|---|---|---|---|---|---|---|---|---|---|---|---|
| 1 | 2 | 3 | 4 | 5 | 6 | 7 | 8 | 9 | 10 | 11 | 12 | ||
| Min Temperature(°F) | 43.0 | 43.0 | 48.0 | 54.0 | 57.0 | 64.0 | 68.0 | 68.0 | 66.0 | 61.0 | 55.0 | 48.0 | 56.0 |
| Avg Temperature(°F) | 50.0 | 51.0 | 55.0 | 61.0 | 66.0 | 73.0 | 77.0 | 77.0 | 74.0 | 68.0 | 63.0 | 55.0 | 64.0 |
| Max Temperature (°F) | 57.0 | 59.0 | 63.0 | 68.0 | 75.0 | 82.0 | 86.0 | 86.0 | 82.0 | 75.0 | 70.0 | 61.0 | 72.0 |
| Range | 14.0 | 16.0 | 15.0 | 14.0 | 18.0 | 18.0 | 18.0 | 18.0 | 16.0 | 14.0 | 15.0 | 13.0 | 16.0 |
|
|
||||||||||||||||||||||||||||||||||||||||||||||||||||||||||||||||||||||||||||||||||||||||
|
Mar, Apr, May |
Jun, Jul, Aug |
Sep, Oct, Nov |
Dec, Jan, Feb |
|||||||||||||
|---|---|---|---|---|---|---|---|---|---|---|---|---|---|---|---|---|
| Max | Min | Average | Range | Max | Min | Average | Range | Max | Min | Average | Range | Max | Min | Average | Range | |
| Min Temperature | 57.0 | 48.0 | 53.00 | 9.0 | 68.0 | 64.0 | 66.67 | 4.0 | 66.0 | 55.0 | 60.67 | 11.0 | 48.0 | 43.0 | 44.67 | 5.0 |
| Avg Temperature | 66.0 | 55.0 | 60.67 | 11.0 | 77.0 | 73.0 | 75.67 | 4.0 | 74.0 | 63.0 | 68.33 | 11.0 | 55.0 | 50.0 | 52.00 | 5.0 |
| Max Temperature | 75.0 | 63.0 | 68.67 | 12.0 | 86.0 | 82.0 | 84.67 | 4.0 | 82.0 | 70.0 | 75.67 | 12.0 | 61.0 | 57.0 | 59.00 | 4.0 |
| Temperature |
+
|
| Month | Average | ||||||||||||
|---|---|---|---|---|---|---|---|---|---|---|---|---|---|
| 1 | 2 | 3 | 4 | 5 | 6 | 7 | 8 | 9 | 10 | 11 | 12 | ||
| Avg Temperature (°F) | 50.0 | 51.0 | 55.0 | 61.0 | 66.0 | 73.0 | 77.0 | 77.0 | 74.0 | 68.0 | 63.0 | 55.0 | 64.0 |
|
|
||||||||||||||||||||||||||||||||||||||||||||||||
|
Mar, Apr, May |
Jun, Jul, Aug |
Sep, Oct, Nov |
Dec, Jan, Feb |
|||||||||||||
|---|---|---|---|---|---|---|---|---|---|---|---|---|---|---|---|---|
| Max | Min | Average | Range | Max | Min | Average | Range | Max | Min | Average | Range | Max | Min | Average | Range | |
| Avg Temperature | 66.0 | 55.0 | 60.67 | 11.0 | 77.0 | 73.0 | 75.67 | 4.0 | 74.0 | 63.0 | 68.33 | 11.0 | 55.0 | 50.0 | 52.00 | 5.0 |
| Humidity |
+
|
| Month | Average | ||||||||||||
|---|---|---|---|---|---|---|---|---|---|---|---|---|---|
| 1 | 2 | 3 | 4 | 5 | 6 | 7 | 8 | 9 | 10 | 11 | 12 | ||
| Avg Humidity (%) | 75.0 | 72.0 | 68.0 | 68.0 | 67.0 | 65.0 | 63.0 | 63.0 | 67.0 | 71.0 | 73.0 | 76.0 | 64.0 |
|
|
||||||||||||||||||||||||||||||||||||||||||||||||
|
Mar, Apr, May |
Jun, Jul, Aug |
Sep, Oct, Nov |
Dec, Jan, Feb |
|||||||||||||
|---|---|---|---|---|---|---|---|---|---|---|---|---|---|---|---|---|
| Max | Min | Average | Range | Max | Min | Average | Range | Max | Min | Average | Range | Max | Min | Average | Range | |
| Avg Humidity | 68.0 | 67.0 | 67.67 | 1.0 | 65.0 | 63.0 | 63.67 | 2.0 | 73.0 | 67.0 | 70.33 | 6.0 | 76.0 | 72.0 | 74.33 | 4.0 |
| Precipitation |
+
|
| Month | Monthly average | Annual total | ||||||||||||
|---|---|---|---|---|---|---|---|---|---|---|---|---|---|---|
| 1 | 2 | 3 | 4 | 5 | 6 | 7 | 8 | 9 | 10 | 11 | 12 | |||
| Average monthly precipitation (in) | 3.9 | 3.3 | 2.8 | 2.6 | 1.3 | 0.6 | 0.3 | 0.6 | 1.5 | 3.9 | 3.9 | 4.5 | 2.4 | 29.2 |
| Wetdays | 15 | 14 | 12 | 11 | 7 | 4 | 2 | 2 | 6 | 12 | 13 | 15 | 9 | 113 |
| Wetdays ratio (%) | 48.4 15,16 | 50.0 14,14 | 38.7 12,19 | 36.7 11,19 | 22.6 7,24 | 13.3 4,26 | 6.5 2,29 | 6.5 2,29 | 20.0 6,24 | 38.7 12,19 | 43.3 13,17 | 48.4 15,16 |
31.0 30.9589,69.0411 |
|
|
|
|||||||||||||||||||||||||||||||||||||||||||||||||||||||||||||||||||||
|
Mar, Apr, May |
Jun, Jul, Aug |
Sep, Oct, Nov |
Dec, Jan, Feb |
|||||||||||||
|---|---|---|---|---|---|---|---|---|---|---|---|---|---|---|---|---|
| Max | Min | Range | Total | Max | Min | Range | Total | Max | Min | Range | Total | Max | Min | Range | Total | |
| Average monthly precipitation (in) | 2.8 | 1.3 | 1.4 | 6.7 | 0.6 | 0.3 | 0.3 | 1.5 | 3.9 | 1.5 | 2.4 | 9.2 | 4.5 | 3.3 | 1.2 | 11.7 |
| Wetdays | 12 | 7 | 5 | 30 | 4 | 2 | 2 | 8 | 68 | 6 | 62 | 137 | 15 | 14 | 1 | 44 |
| Precipitation |
+
|
| Month | Monthly average | Annual total | ||||||||||||
|---|---|---|---|---|---|---|---|---|---|---|---|---|---|---|
| 1 | 2 | 3 | 4 | 5 | 6 | 7 | 8 | 9 | 10 | 11 | 12 | |||
| Average monthly precipitation (in) | 3.9 | 3.3 | 2.8 | 2.6 | 1.3 | 0.6 | 0.3 | 0.6 | 1.5 | 3.9 | 3.9 | 4.5 | 2.4 | 29.2 |
|
|
||||||||||||||||||||||||||||||||||||||||||||||||||
|
Mar, Apr, May |
Jun, Jul, Aug |
Sep, Oct, Nov |
Dec, Jan, Feb |
|||||||||||||
|---|---|---|---|---|---|---|---|---|---|---|---|---|---|---|---|---|
| Max | Min | Range | Total | Max | Min | Range | Total | Max | Min | Range | Total | Max | Min | Range | Total | |
| Average monthly precipitation (in) | 2.8 | 1.3 | 1.4 | 6.7 | 0.6 | 0.3 | 0.3 | 1.5 | 3.9 | 1.5 | 2.4 | 9.2 | 4.5 | 3.3 | 1.2 | 11.7 |
| Sunlight / Day length |
+
|
| Max day length | Min day length | Sunlight/Day length | |||
|---|---|---|---|---|---|
| Jan |
-9999 min -167 h 21 min |
590 min 9 h 50 min 590,850 |
614 min 10 h 14 min (31.1.) 614,826 |
573 min 9 h 33 min (1.1.) 573,867 |
-1693.6 % -9999,10589 |
| Feb |
-9999 min -167 h 21 min |
647 min 10 h 47 min 647,793 |
679 min 11 h 19 min (29.2.) 679,761 |
616 min 10 h 16 min (1.2.) 616,824 |
-1546.3 % -9999,10646 |
| Mar |
-9999 min -167 h 21 min |
719 min 11 h 59 min 719,721 |
756 min 12 h 36 min (31.3.) 756,684 |
682 min 11 h 22 min (1.3.) 682,758 |
-1391.5 % -9999,10718 |
| Apr |
-9999 min -167 h 21 min |
792 min 13 h 12 min 792,648 |
825 min 13 h 45 min (30.4.) 825,615 |
758 min 12 h 38 min (1.4.) 758,682 |
-1261.8 % -9999,10791 |
| May |
-9999 min -167 h 21 min |
854 min 14 h 14 min 854,586 |
877 min 14 h 37 min (31.5.) 877,563 |
827 min 13 h 47 min (1.5.) 827,613 |
-1170.2 % -9999,10853 |
| Jun |
-9999 min -167 h 21 min |
885 min 14 h 45 min 885,555 |
888 min 14 h 48 min (20.6.) 888,552 |
878 min 14 h 38 min (1.6.) 878,562 |
-1129.4 % -9999,10884 |
| Jul |
-9999 min -167 h 21 min |
869 min 14 h 29 min 869,571 |
885 min 14 h 45 min (1.7.) 885,555 |
847 min 14 h 7 min (31.7.) 847,593 |
-1150.4 % -9999,10868 |
| Aug |
-9999 min -167 h 21 min |
814 min 13 h 34 min 814,626 |
845 min 14 h 5 min (1.8.) 845,595 |
781 min 13 h 1 min (31.8.) 781,659 |
-1227.7 % -9999,10813 |
| Sep |
-9999 min -167 h 21 min |
744 min 12 h 24 min 744,696 |
779 min 12 h 59 min (1.9.) 779,661 |
709 min 11 h 49 min (30.9.) 709,731 |
-1344.3 % -9999,10743 |
| Oct |
-9999 min -167 h 21 min |
670 min 11 h 10 min 670,770 |
706 min 11 h 46 min (1.10.) 706,734 |
636 min 10 h 36 min (31.10.) 636,804 |
-1491.7 % -9999,10669 |
| Nov |
-9999 min -167 h 21 min |
606 min 10 h 6 min 606,834 |
634 min 10 h 34 min (1.11.) 634,806 |
583 min 9 h 43 min (30.11.) 583,857 |
-1649.9 % -9999,10605 |
| Dec |
-9999 min -167 h 21 min |
573 min 9 h 33 min 573,867 |
582 min 9 h 42 min (1.12.) 582,858 |
570 min 9 h 30 min (21.12.) 570,870 |
-1744.6 % -9999,10572 |
| Year |
-10832 min -181 h 28 min |
731 min 12 h 11 min 731,709 |
888 min 14 h 48 min (20. 6.) 888,552 |
570 min 9 h 30 min (21. 12.) 570,870 |
-1482.7 % -10832,11563 |
|
Mar, Apr, May |
Jun, Jul, Aug |
Sep, Oct, Nov |
Dec, Jan, Feb |
|||||||||||||
|---|---|---|---|---|---|---|---|---|---|---|---|---|---|---|---|---|
| Max | Min | Average | Sunlight/day | Max | Min | Average | Sunlight/day | Max | Min | Average | Sunlight/day | Max | Min | Average | Sunlight/day | |
| (min/day) | -9999 | -9999 | -9999 |
-1268.2% -9999,10787 |
-9999 | -9999 | -9999 |
-1168.1% -9999,10855 |
-9999 | -9999 | -9,999 |
-1485.0% -9999,10672 |
-9999 | -9999 | -9999 |
-1659.7% -9999,10601 |
| Day length | 877 | 682 | 788 | 888 | 781 | 856 | 779 | 583 | 673 | 679 | 570 | 602 | ||||
| Day length |
+
|
| Max day length | Min day length | ||
|---|---|---|---|
| Jan |
590 min 9 h 50 min 590,850 |
614 min 10 h 14 min (Array.1.) 614,826 |
573 min 9 h 33 min (1.1.) 573,867 |
| Feb |
647 min 10 h 47 min 647,793 |
679 min 11 h 19 min (Array.2.) 679,761 |
616 min 10 h 16 min (1.2.) 616,824 |
| Mar |
719 min 11 h 59 min 719,721 |
756 min 12 h 36 min (Array.3.) 756,684 |
682 min 11 h 22 min (1.3.) 682,758 |
| Apr |
792 min 13 h 12 min 792,648 |
825 min 13 h 45 min (Array.4.) 825,615 |
758 min 12 h 38 min (1.4.) 758,682 |
| May |
854 min 14 h 14 min 854,586 |
877 min 14 h 37 min (Array.5.) 877,563 |
827 min 13 h 47 min (1.5.) 827,613 |
| Jun |
885 min 14 h 45 min 885,555 |
888 min 14 h 48 min (Array.6.) 888,552 |
878 min 14 h 38 min (1.6.) 878,562 |
| Jul |
869 min 14 h 29 min 869,571 |
885 min 14 h 45 min (Array.7.) 885,555 |
847 min 14 h 7 min (31.7.) 847,593 |
| Aug |
814 min 13 h 34 min 814,626 |
845 min 14 h 5 min (Array.8.) 845,595 |
781 min 13 h 1 min (31.8.) 781,659 |
| Sep |
744 min 12 h 24 min 744,696 |
779 min 12 h 59 min (Array.9.) 779,661 |
709 min 11 h 49 min (30.9.) 709,731 |
| Oct |
670 min 11 h 10 min 670,770 |
706 min 11 h 46 min (Array.10.) 706,734 |
636 min 10 h 36 min (31.10.) 636,804 |
| Nov |
606 min 10 h 6 min 606,834 |
634 min 10 h 34 min (Array.11.) 634,806 |
583 min 9 h 43 min (30.11.) 583,857 |
| Dec |
573 min 9 h 33 min 573,867 |
582 min 9 h 42 min (Array.12.) 582,858 |
570 min 9 h 30 min (21.12.) 570,870 |
| Year |
731 min 12 h 11 min 731,709 |
888 min 14 h 48 min (21. 6.) 888,552 |
570 min 9 h 30 min (22. 12.) 570,870 |
|
Mar, Apr, May |
Jun, Jul, Aug |
Sep, Oct, Nov |
Dec, Jan, Feb |
|||||||||
|---|---|---|---|---|---|---|---|---|---|---|---|---|
| Max | Min | Average | Max | Min | Average | Max | Min | Average | Max | Min | Average | |
| Day length | 877 | 682 | 788 | 888 | 781 | 856 | 779 | 583 | 673 | 679 | 570 | 602 |
|
|
|

|
|
|
|
|||
|
|
|
|||
|
|
|